Natalie Jeremijenko is an artist and engineer whose work explores the intersection of human and environmental health. In a series of conversations, we spoke about data, visualization, and the process of making sense of complex phenomena. The following is a heavily edited transcript of her words.
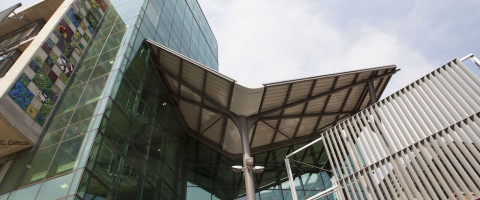
Making Sense: Gravity Probe B
If we’re alert to our own ways of making sense of context and what really works to make sense and what we trust, we can start to really question how we visualize and how we make sense of the world.
In my engineering work, working in precision engineering on Gravity Probe B at Stanford with some wonderful people, I learned a lot about physics but also began to really understand how I was making sense of things. Gravity Probe B was the only academic satellite ever launched. It was to test the warp of space-time, testing general relativity theory. While I love physics and the opportunity to dive into gravitational theory was fantastic, what was really sense-making for me — in terms of how to make sense — was building this precision optics system, which was so much about a fairly humble material understanding of the quartz ball that was in the gyroscope that measured the warp of spacetime that was held by this precision optic system inside the satellite that I was working on. That this was the roundest object ever made in the history of the world.

To me, this idea of translating, in a very material object and through very material practices, these complex physical phenomena is very powerful. Being able to twist a ball on a bed sheet to intuitively test your understanding of how spacetime worked, to be able to think through a hard mathematically-described phenomenon with these radically different forms of representation is of course how we make sense of things. It’s not being able to perfectly understand it in one language, it’s about being able to make those metaphorical contrasts. You can prototype a sort of understanding. Think about torque — you can quote the physics slogan of what torque is but it’s actually physically bending and twisting your pen that can really make concrete what the forces involved mean.
I think hands-on, problem driven learning, and the shifts in engineering education towards this kind of material practice is about helping people to think across these domains, because doing lots of problem sets doesn’t make you a great engineer. It doesn’t develop your intuitions. So to some extent, there’s a recognition that hands-on, peer-driven, socially-situated, contextualized problems make sense.
This is related to research I did on the attrition of women and minorities form engineering fields. This was in the early 90s, when the NSF had these huge consortiums of engineering schools and they had six or seven major engineering schools looking at this issue, doing exit interviews with women and minorities that had dropped out of engineering to see what they said and justify the fact that in general and all along the pipeline, women and minorities tend to get higher GPAs, yet drop out at a higher rate. The traditional way to think about this is to sort of talk about the hostility towards women and minorities in these engineering and technical fields, or at worse to say something like “women are just not good at it.” Well, that’s just not the case!
What I came to understand it as, is not as a problem of women and minorities somehow not being able to acculturate, but as a massive social protest. If you looked at all the exit interviews, they all basically said, “I want to help people, I want to do something that helps people,” — this naïve way of saying that the militarized, DARPA-funded and corporate engineering being taught is just not interesting, it’s just not what young people want to do. So the attrition rate is more a massive social protest that this is not the kind of work we want to do. [It says,] we want to do something that’s more meaningful, taking on a huge and important challenge, instead of building a better ballistics system, or a robotic arm for industrial assembly that has an extra degree of freedom or tactile manipulation — projects that just are not that compelling.
Playful Data: Feral Robotic Dogs
So to transform engineering education, you create problems and issues that are socially embedded in real compelling political contexts, and the feral robotic dogs project was an example of that. We start with these consumer toy robots. You open them up and you can see what was hand-soldered, you can see the labor that’s gone into them and the ingenuity, you can gently amputate the legs. You’re critiquing a manufactured object, in some sense reverse-engineering it to make it perform in an all-terrain context —what the feral robots league was really about. And of course you’re updating its rasion d’etre by adding the environmental toxin sensor, and by adding an additional microprocessor. So you program the dogs to follow the concentration gradient of the environmental contaminant that they were being exposed to.
The sensors we put in the dog’s noses were measuring VOC — volatile organic compounds — the most ubiquitous urban pollutant. Then we designing the dogs to release them on public contaminated sites, and with their movement they display data about pollution in the area. We were capturing data that we could later analyze, but the immediate sense-making was, “Oh, the dog is going over there! Oh, the dog’s chasing a car!” They actually kept going towards the nearest road, which of course ends up being the biggest lesson of these robotic dog packs that we released all over the country was that what dominates is not the subsoil contaminants, but the traffic — the cars.

But what would then happen is that journalists and other people would turn up and they would ask the students who worked on the dogs, the dog trainers, “What’s your dog finding? What does it mean? What do we do about it?” And of course the students had been working on their dogs and thinking about this site and they can answer, they address it. It’s not about me collecting all this data inexpensively with these low-cost robots and student labor, it’s actually the collective issue of making sense of a very tricky problem. There is no absolute answer about what the contaminants are in the environment and how they’re affecting human health. There are these contaminants, and the data helps us to make sense of it, but it’s also really a collective process of asking people to think about it.
Through these conversations we might start to make sense of what could be done, what should be done? What do you do about VOCs? Is this an issue that’s totally dominated by nearby road traffic or are these hot spots? How does this contribute to asthma rates in the neighborhood? So all these questions are not ones in which any expert has the definitive answer, but what’s important is facilitating this sort of project where we can make sense of it without pretending that the data is going to tell us everything — that meaning is going to drop out of the data.
Meaning and sense-making are social processes. In a sense, all of the projects I’ve done are in this realm of trying to make sense of these irreducibly complex socioecological systems, in which there isn’t a simple experiment or a paper, or even a discipline or an expertise that can alone figure out what we can do. These are questions that can lead to the crisis of agency that we all face, what do I do? What does little old me do? What does any one of us do in the face of so many challenges?
Beyond Snapshots: The Phenological Clock
I’m very interested in using the authority of natural systems to reinvigorate the imaginative capacities of political and social structures of participation. So I’m very specifically interested in finding mutualistic relationships to amplify, letting them emerge from the data, and correcting for the systematic blindness to mutualistic systems.
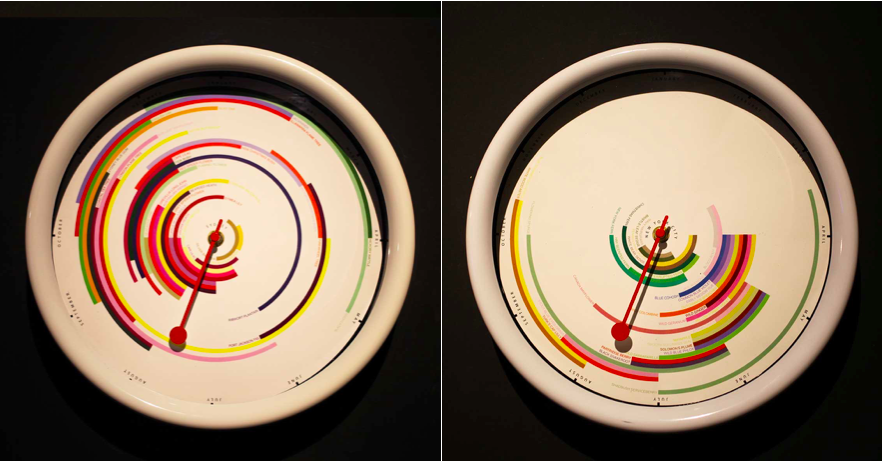
With the phenological clock, the effort of this visualization is to reveal the temporal interdependence. There’s a lot of things we’ve been looking at, to look at the shifts over the years, and how the pollinator that depends on the flower, if they shift out of sync, then with the birds that depend on the insect, you’ll see that. I think this works as an icon, just to say, it’s not a field guide, these organisms are always in relation to each other and that it’s a dynamic, temporal system that’s not a photograph. Which I think is the opportunity that data presents us, rather than doing that slice in time.
Compared to the snapshot idea — that you could take a snapshot here, maybe a snapshot there — the phenological clock privileges that these systems are always and already changing. It’s about these seasonal phenomena that are very material and specific and constituted by the complex ecosystems that occur.
This is still very much in development, but I’m really interested in how it invites further observation, that in itself it’s not visualizing the data retrospectively, it’s more that it invites having it around and ubiquitous in a public platform, on a watch, or in this kind of non-science venue. That it would invite people to think, “Oh, it’s daffodil time,” or, “The tomatoes are starting to grow,” that it becomes interwoven with social, lived reality. Where I went to school, the jacarandas always bloomed when it was exam time, so there was always a kind of dread when we saw these beautiful purple flowers. The idea is to start to weave together social events and reconstitute convivial social lived experience with these natural phenomena.
It also invites the Instagram image where you can tag it with the project hashtag and it has the species, and it has the geolocation, and it has the time — which gives us all the information we need for the clock. It’s already a populist thing to do, and yet it underscores that simple kind of wonderment and the act of observing. It’s underscoring our collective attention. That your attention is contributing to our collective understanding.
To some extent I don’t like the idea of data visualization, because there isn’t that citation or the reference there to be able to question their assumptions or their method. You don’t even have error bars, or any of the cues that — if you’re familiar with the dataset or familiar with the argument that you would use — it obfuscates. It does the reverse of inviting participation, it closes it, says, “It’s done, we thought about this, it’s done, it’s over, you don’t need to think about it.”
This idea of data spectatorship—this passive consumption of data visualization—that’s what I’m working against, the data spectator. I suppose it’s about going from data spectator to data contact sports or something.
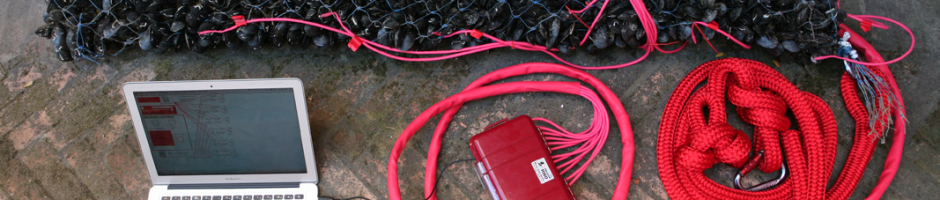
Natural Intelligence: One Trees and the Mussel Choir
With the One Trees project, we planted 80 genetically identical trees in the same place, in pairs, so you could see the within-pair and between-pair differences, and visited them over the years to try to make sense of why do these trees look different? Why have they diverged so extraordinarily?
So I was looking at this pair of trees at 22nd and Valencia in San Francisco and there was a man working construction across the road. He saw me looking at these trees and he came over to ask me what I was doing. I told him about the project and how these trees are about 12 years old and I can’t make sense of why they look so different. I thought one had gotten into the water mains and the other hadn’t, that it had gotten a taproot in. But I found they actually use terra cotta mains in San Francisco, which means that since it’s a seismically active area, all those terra cotta mains are cracked and leaking and subsidizing the entire urban forest. So it’s not that this is hermetically sealed system.
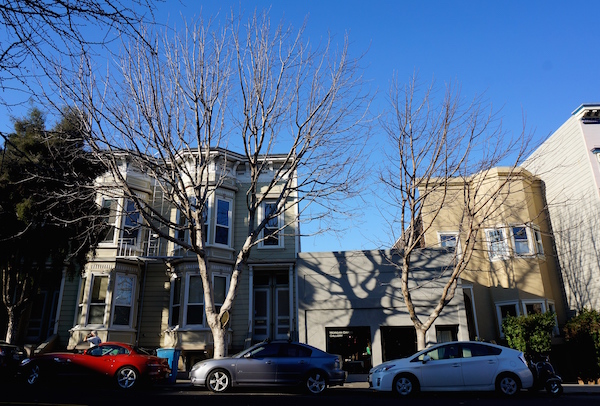
I just could not make sense of it. I looked at leaf width, looked at solar exposure, looked at everything I could to figure it out and I couldn’t figure out! And then, after I explained the project to him, this guy working in construction said, “Oh it’s totally obvious why they’re different!” and I said, “It is?” He said, “Well, look behind the trees.” One has a little 1950s one-story building behind it, the big one has an old Victorian behind it, two stories and lovely. He said, “Well between those structures was the 1906 earthquake.” And then he had to explain to me that that meant that building codes had changed and foundations had radically changed and probably that what I was seeing was that the tree in front of the small structure is like a massive bonsai — it has a strong foundation that blocks off the roots — whereas the one under in front of the Victorian probably had roots that extend all the way through the and under the Victorian. This was the best explanation I’d had. I wanted to tell that story because that’s coming not from an arborist’s point of view, or soil science, or stomatal blockages from particulate matter, or ozone, or any of the issues that we thought.
Another time there was a group of students from the creative writing studio from around the corner that came by and one of the kids wanted to watch for which tree the birds preferred. I was so struck by this idea, that perhaps somehow the birds could make sense of this better than we could, which I thought was another delightful idea about how we could observe and make sense of urban ecosystems.
The Mussel Choir project is also about looking to animals in order to give us this kind of information about complex ecosystems. The first hit single of the mussel choir is “The Bicycle Built for Two,” that goes, ”Daisy, Daisy tell me your answer true.” This is an icon of artificial intelligence because HAL sings it in 2001, Siri sings it, it was the first computer-synthesized voice — so it has become this icon. Aaron Koblin did this lovely piece on distributed intelligence, using 2000 Amazon Mechanical Turkers, having them each sing “aah” at different notes and putting them all together into “A Bicycle Built for Two Thousand.” The hit single for the mussels is “A Bicycle Built for Too Many,” which is sung by the mussels. As they open and close, I’m sensing their gape angle and converting that to synthesized sound.
The mussels are responding to the local conditions, integrating over the many different parameters, many more than we can measure in our battery of water quality tests. They are of course responding intelligently, as if their lives depended on it! I use that to have them sing “The Bicycle Built for Too Many” in order to iconify and contrast to the AI approach, the artificial intelligence approach, or this distributed intelligence approach. I call this the natural intelligence approach, NI — as opposed to AI — which is that we can draw on the sense-making of mussels or the birds choosing one tree over the other, or how the trees themselves respond to their environment.
This kind of making sense of the material world with these radically different representations that come from diverse organisms is critical for making sense of these complex urban ecosystems. They give us this immediate feedback cycle, where we’re not just looking at some sort of blank array of distributed low power sensors. The vision of the “smart city” is that we’ll have these sensors everywhere, electronic sensors that will somehow make sense of things. But we can see that with the battery of what we use to make sense of water quality — dissolved oxygen, turbidity, pH, salinity — even water quality experts can’t tell you what that means. But if the mussels can survive, if they can thrive, or if they don’t thrive, or if their flapping in panic, or if they’re clammed shut and not singing—I trust a mussel more than the data! There can’t be any decimal point errors or recalibration issues when their lives depend on it.
So this idea that we can make sense through and with these diverse representations and these non-human organisms and is really part of the story of how you make sense of things in order to act on them, to improve and change our relationship to natural systems. The goal is to redesign this relationship so that we actually can increase biodiversity and increase water quality, using living infrastructure to make these places more habitable.